TK Elevator Data Reveals Significant Urban Mobility Changes Over Last Year
It’s no secret the last 12 months brought remarkable changes to how Americans live and work. Beyond COVID-19’s impacts on economies and human health, commercial building and residential high-rise usage has varied dramatically throughout the pandemic.
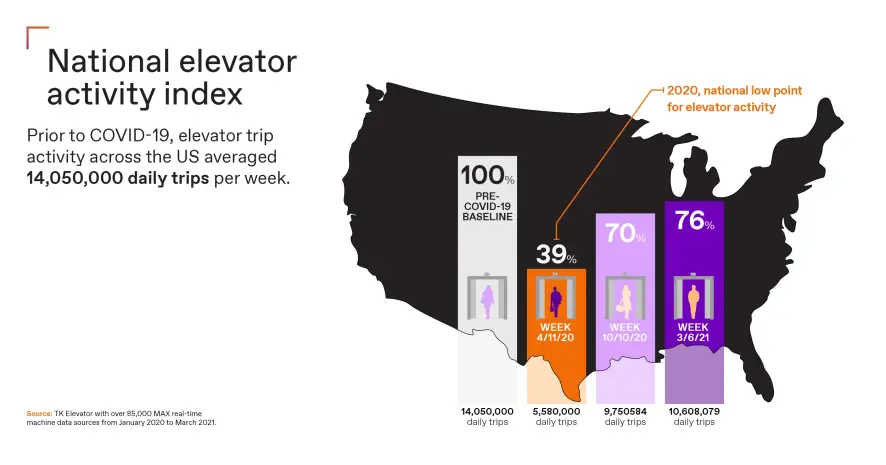
Newly-released data from over 85,000 elevators across the nation reveals a staggering one-month elevator traffic decline to 39% of pre-pandemic levels in April 2020, after potential impacts of COVID-19 exposure were widely known. In the past 12 months, TK Elevator has observed some regions and market segments recovering to 100% of pre-pandemic elevator traffic levels, while others are still experiencing significant and potentially permanent shifts in urban mobility and activity.

To help plan more effectively for an uncertain future, TK Elevator has created an Index to measure elevator traffic from across the U.S. at both a macro and micro level. This data is a leading indicator of urban mobility, and offers critical planning information for municipal governments, building managers, health authorities and law enforcement.
TK Elevator uses MAX, the elevator industry's first cloud- and IoT-based platform, to create the Index. MAX is installed on over 85,000 elevators across the country. It enables enhanced service and predictive maintenance along with transparency and customer peace of mind.
Elevator traffic during COVID-19
As COVID-19 swept across the nation in March 2020, some states enacted strict non-essential travel policies to limit exposure and promote social distancing. The TK Elevator Index indicates elevator traffic in commercial office and hospitality buildings dropped dramatically, while healthcare and residential building elevator traffic remained consistent.
TK Elevator recognizes that social distancing measures have limited elevator car occupants to pre-defined numbers in many buildings, which can create challenges in comparing total building foot traffic to elevator traffic.
In the month following the introduction of widespread work- and learn-from-home policies, our data shows a dramatic decline in nationwide elevator traffic, reaching 39% of pre-pandemic levels the week of April 11, 2020. The data also shows a drop from approximately 14 million daily trips to under 6 million. That is over 8,000,000 fewer elevator trips compared to pre-COVID baselines!
Following the initial steep decline in activity, the next 12 months reveals steady but regionally uneven traffic increases, with national elevator traffic reaching approximately 76% of pre-pandemic levels by the week of March 6, 2021.
Highlights of state elevator activity
A wide range of factors impacted elevator activity levels across the country, and some states experienced more dramatic changes than others.

California
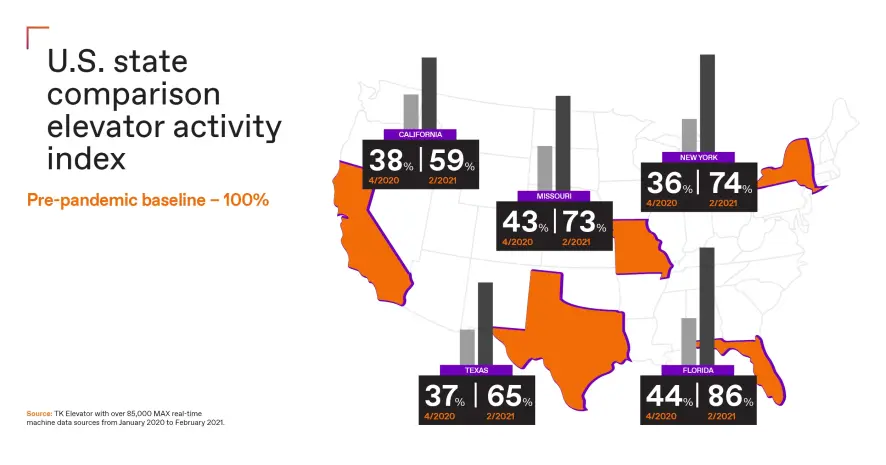
In the Golden State, monthly elevator traffic declined to 38% of pre-pandemic baselines in April 2020, while elevator activity has returned to 59% in February 2021.
Major California cities including San Francisco (45%), San Jose (55%) and Los Angeles (57%) have significantly lower elevator traffic than pre-pandemic levels. One urban outlier is Oakland, which has recovered to 80% of its pre-pandemic elevator activity levels.
Florida
The Sunshine State experienced an elevator traffic decline to 44% of its pre-pandemic-baselines in April 2020, but traffic has recovered to nearly 86% of pre-pandemic levels.
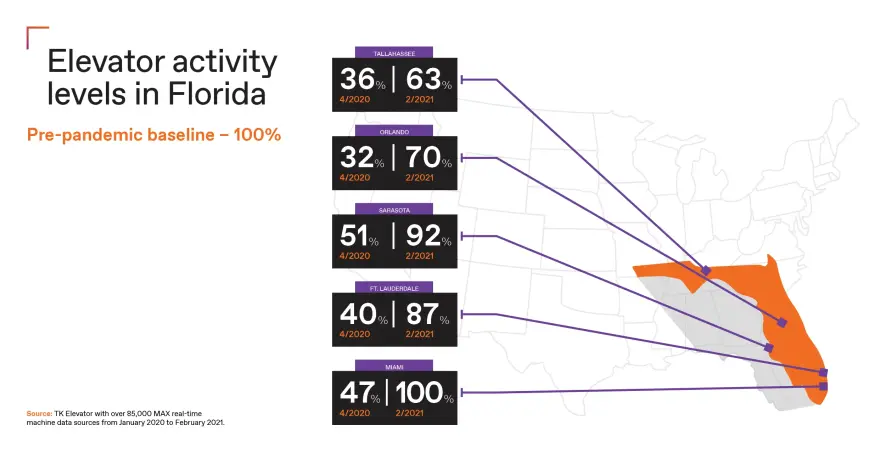
Major coastal destinations have some of the highest elevator activity levels. In February 2021, Miami had recovered to 100% of its pre-pandemic activity levels. Sarasota and Fort Lauderdale were not far behind with elevator activity levels at 92% and 87% of their pre-COVID-baseline.
Inland cities are lagging with Orlando at 70% and Tallahassee at 63%.

Missouri
The midwestern state of Missouri had an elevator traffic decline to 43% of pre-pandemic baselines in April 2020, while traffic has recovered to 73% of pre-pandemic levels.
St. Louis elevator traffic declined to 51% of its pre-pandemic baseline in April 2020, but has since risen to 73%. Kansas City elevator traffic dropped to 44% in April 2020, but has now returned to 65% of its pre-pandemic baseline.
New York
The state of New York experienced a decline to 36% of pre-pandemic elevator traffic in April 2020. Traffic has since returned to 74% of pre-COVID-levels.
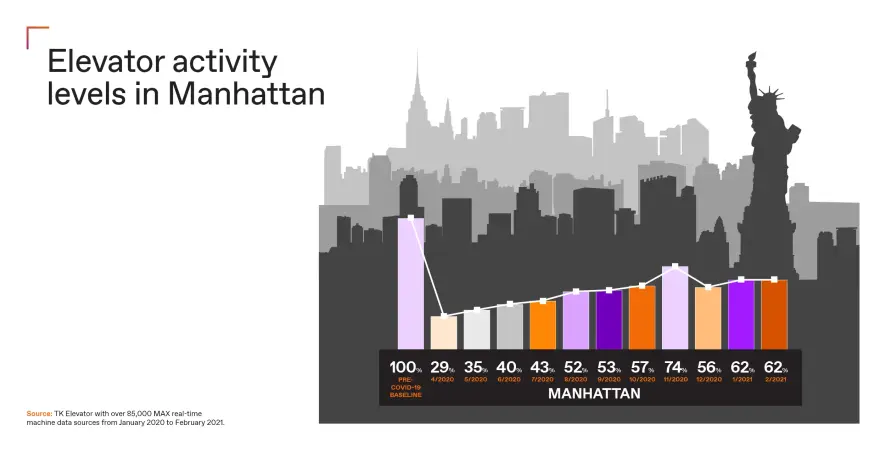
Manhattan led the way with a massive drop to 29% of its pre-pandemic baseline, but traffic has since grown to 62%.

Texas
The Lone Star State declined to 37% of pre-pandemic elevator traffic in April 2020. It has recovered moderately with a 65% return to pre-pandemic levels.
Large Texas urban centers experienced significant elevator traffic drops, with Austin declining to 28% in April 2020, and since recovering to 46% of pre-COVID traffic levels. Houston elevator traffic declined to 43% of pre-pandemic baselines in April 2020 and has recovered to 63%.
Dallas elevator traffic dropped to 47% in April 2020 but has recovered to 69% of pre-COVID levels.
Planning for the future
To help buildings adapt to expected traffic increases, TK Elevator offers many innovative solutions.
These include our MAX cloud- and IoT-based digital technology platform, which does more than reveal elevator traffic levels. The real-time machine data from MAX helps ensure reliable elevator performance and prevents disruptions during periods of increased activity.
Information is power. Utilizing insights gained from MAX, we can unleash positive impacts on our buildings and the people who live and work in them every day.
 United States


