What Urban Mobility Data Reveals About Shifting Centers of Activity
The Centers for Disease Control now reports that nearly two-thirds of US adults are inoculated against COVID-19. Meanwhile, the Bureau of Economic Analysis has reported above average growth in GDP, led by sectors like professional services, real estate, retail and accommodation.
These positive trends highlight a strong American recovery, but many of us recognize that recovery does not mean return. Commentators have recognized the need for a new normal, but this “normal” has yet to be defined.
TK Elevator understands the need for strong indicators to identify the new normal and forecast the future of urban mobility. That’s why we compile elevator data from MAX digital technology into the TK Elevator Index. MAX, the elevator industry’s first cloud-based, predictive maintenance solution is installed on over 85,000 elevators across the country to extract data and provide predictive and proactive service to customers.
Summertime Office Growth
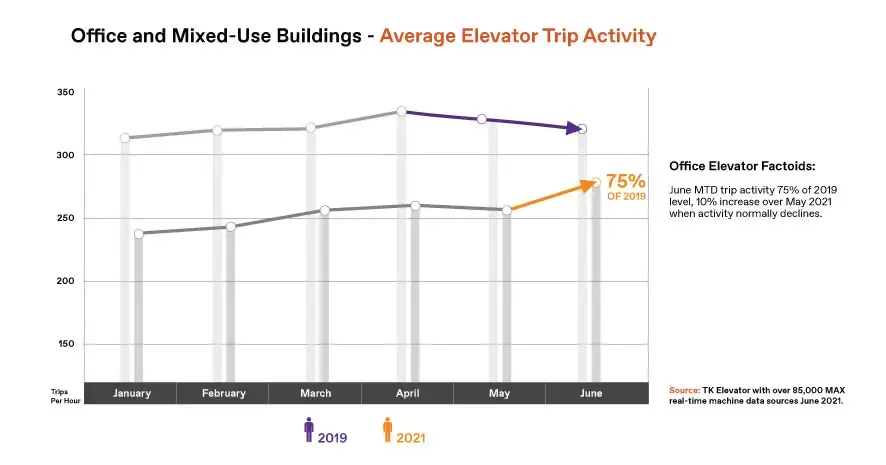
In June 2021, elevator trip activity returned to 83% of pre-pandemic levels, but office elevator-use lagged at 75%. Still, the new June data shows a strong upswing from the 52% recovery we noted in April and a 10% increase since May alone.

The summertime growth is even more exciting considering a typical year’s holiday slowdown. In 2019, office elevator trips declined by 2% between May and June. This year’s increase indicates an economy eager to get back to work.
Shifting Centers of Commerce
Despite the strengthening business recovery, elevator use trends remain different than pre-pandemic baselines. The TK Elevator Index is beginning to suggest lasting shifts away from the country’s largest commercial centers.

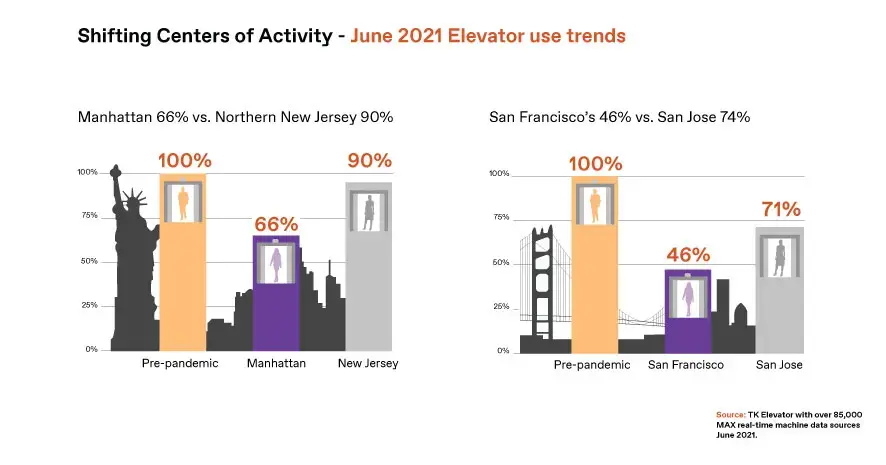
Across the country, elevator activity in central business districts remained depressed compared to surrounding mixed-use or residential areas.
- Manhattan activity remained at 66% of the pre-pandemic baseline, while activity recovered to 90% in northern New Jersey.
- In Silicon Valley, San Francisco’s activity remained at 46% of baseline while San Jose’s was at 71%.
As employers consider flexible work schedules and question the daily commute, the economic recovery is ushering in a more decentralized “normal.” As our June TK Elevator Index data suggests, the workplace is experiencing some of the most dramatic post-pandemic shifts. Data from MAX can help companies make savvy choices and rapidly respond to the needs of the changing business landscape.
 United States

