Elevator Traffic in the COVID Era: One Year Later
Month by month, we continue to see encouraging signs showing the economy recovering and commercial building traffic on the rise.
As revealed in the first TK Elevator Index, April 2020 had by far the lowest elevator activity levels, declining to 39% of pre-pandemic levels. Since November 2020, almost all regions and building segments have shown continued growth. The rate of recovery largely depends on geography and the industry segment makeup of commercial buildings.
TK Elevator uses its MAX digital technology data to produce the Index. MAX, the elevator industry’s first cloud-based, predictive maintenance solution is installed on over 85,000 elevators across the country to extract data and provide predictive and proactive service to customers.

Nationwide elevator traffic is on the rise
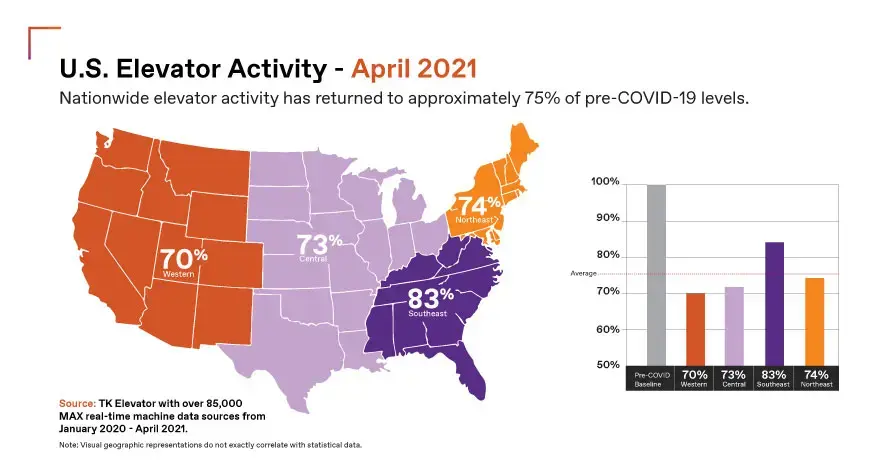
One year into the COVID-19 pandemic, in April 2021, total nationwide elevator activity was approximately 75% of the pre-COVID-19 baseline. The comeback is partially attributed to a swift national vaccine roll-out, long overdue vacations in coastal destinations and an increasing number of employers welcoming and encouraging employees back to the office.
Across the United States, on a region-by-region basis, the southeast continues to lead the recovery at 83% of elevator activity versus the pre-COVID-19 baseline. Part of this can be explained by the large concentrations of coastal mid-to-high-rise hospitality and residential properties in states such as Florida and South Carolina.

Regional elevator activity varies greatly
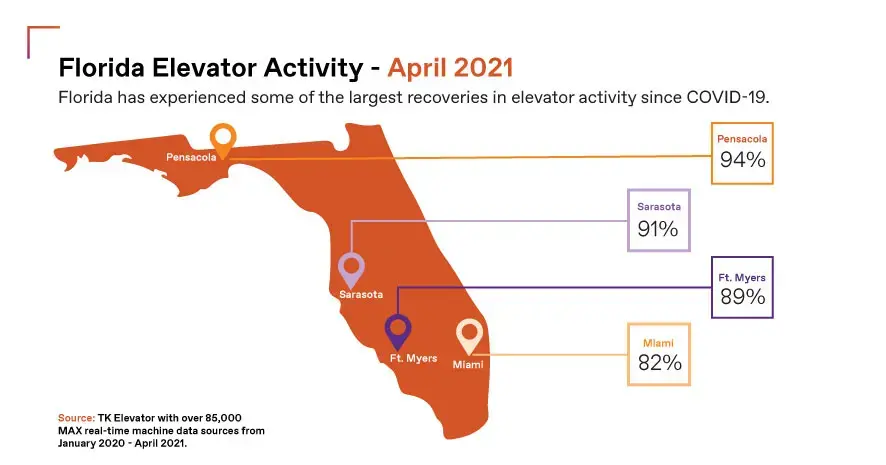
Florida in particular has experienced some of the largest upticks in elevator activity. Cities such as Pensacola (94%), Sarasota (91%), Ft. Myers (89%), and Miami (82%) continue to perform above the national and regional averages. Hotels in this region have experienced high levels of activity, but not quite at the same corresponding months in 2019.
The central U.S. region is currently at 73% of pre-COVID-19 elevator activity levels. Areas with high concentrations of office buildings in the downtown core lag the overall recovery. For example, in Illinois, we are seeing strong activity levels in Peoria at 87% versus downtown Chicago with a 6% one-month increase to 62%.
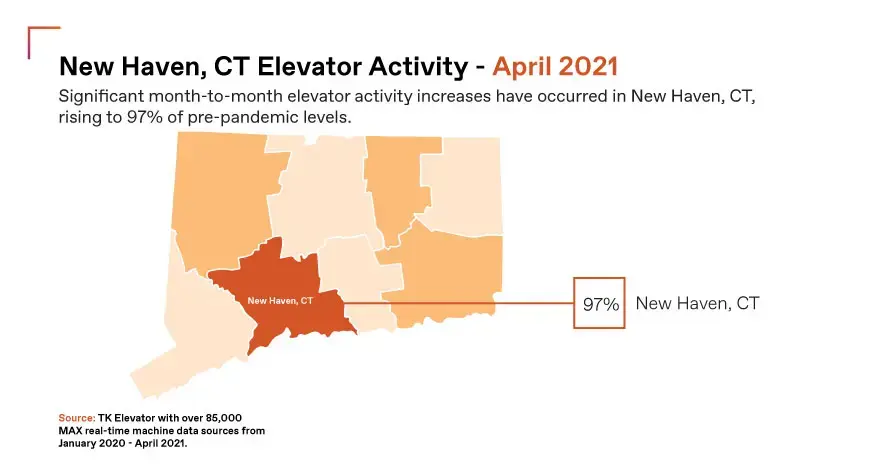
Northeast (74%) and western (70%) regions continue to recover month-to-month, but still have a way to go to reach pre-COVID-19 baseline levels. One bright spot is the significant month-to-month elevator activity increases in New Haven, Connecticut, rising to 97% of pre-pandemic levels.

More people are on the move
TK Elevator recognizes that social distancing measures have limited elevator car occupants to pre-defined numbers in many buildings, which can create challenges in comparing total building foot traffic to elevator traffic. Regardless, as our Index is showing, more people are on the move in cities and in commercial buildings.
 United States

